Category: Patient Lifts
Posted by 2025-12-29 11:12
hoyer lift graphic
Hoyer Lift Graphic Guide: Visual Understanding of Patient Lifts
In the fields of medical equipment and caregiving training, graphic materials hold irreplaceable value for understanding the complex operations and safety standards of Hoyer Lifts. This article will guide you through exploring how various graphic resources can help you better understand and use patient lifts.
Technical Diagrams and Cross-Sections
Structural Breakdown Diagrams
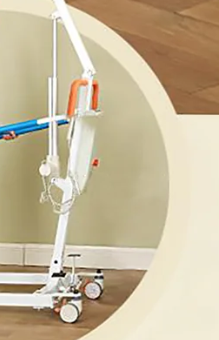
Overall Structure: Displays the complete components of the base, column, boom, and hydraulic system.
Detail Magnification: Highlights key parts such as the hook mechanism, safety locks, and sling connection points.
Material Labeling: Uses different colors and textures to distinguish between metal structures, plastic components, and textile parts.
Dimension Marking: Clearly indicates specific dimensions of the equipment in both expanded and stored states.
Working Principle Diagrams
Hydraulic System Flowchart: Uses arrows and icons to show the flow path of hydraulic oil during lifting and lowering.
Mechanical Principle Diagram: Demonstrates the force distribution of the equipment under load through vector arrows.
Electrical System Diagram: Schematic of the circuit and battery management system for electric models.
Safety Mechanism Diagram: Visually illustrates how various safety devices operate.
Graphic Guide for Operational Steps
Sequential Operation Diagrams
Numbered Steps: Each step is marked with a prominent number.
Action Sequence: Shows the complete operation process through continuous frames.
Error Demonstration: Compares correct and incorrect operations using "×" and "✓" symbols.
Progress Indication: A color bar shows the progress of completing the operation.
3D Schematic Diagrams
Multi-Angle Views: Simultaneously displays top, side, and front views.
Transparent Effect: Shows internal mechanical operations through a semi-transparent outer shell.
Cross-Section Display: Cuts through part of the structure to show internal components.
Animation Demonstration: Dynamically shows the equipment’s operation process.
Safety Guide Infographics
Risk Assessment Diagrams
Color Coding: Uses red, yellow, and green to indicate risk levels.
Hotspot Areas: Marks danger points requiring special attention on the equipment diagram.
Weight Distribution: Graphically shows the load-bearing impact of users with different weights.
Space Requirements: Shows the minimum safe operating space through a top-down view.
Checklist Diagrams
Daily Inspection: Uses icons to represent components that need inspection.
Problem Identification: Shows normal and abnormal states through comparison diagrams.
Maintenance Schedule: hoyer lift graphic Displays the timeline for different maintenance tasks in a calendar format.
Emergency Procedures: Shows emergency response steps in a flowchart format.
Training and Educational Graphics
Anatomical Relationship Diagrams
Ergonomics: Shows the interaction between the equipment and the human anatomical structure.
Pressure Distribution: Uses heat maps to show pressure distribution at the contact points between the sling and the body.
Movement Trajectory: Arrows show the body’s movement path during the lifting process.
Biomechanics: Demonstrates the correct body mechanics for caregivers when using the equipment.
Comparative Analysis Diagrams
Model Comparison: Side-by-side display of key differences between different models.
Brand Comparison: Radar charts for multi-dimensional comparison of product features across brands.
Evolution Timeline: A timeline showing the technological development of the equipment.
Scenario Adaptation: A matrix diagram showing equipment selection recommendations for different scenarios.
Data Visualization Applications
Statistical Infographics
Usage Data: Bar charts showing usage frequency in different scenarios.
Safety Statistics: Pie charts showing the proportion of various operational accidents.
Cost Analysis: Stacked bar charts showing costs at different stages of the equipment’s life cycle.
Effect Evaluation: Line charts showing improvements in care quality before and after using the equipment.
Technical Specification Diagrams
Parameter Comparison: Bar charts comparing technical parameters of different models.
Performance Curves: hoyer lift graphic Line charts showing the equipment’s performance under different loads.
Size Range: Uses a scale to intuitively show the size range of the equipment.
Weight Distribution: Donut charts showing the weight proportion of each component of the equipment.
Accessibility Design Graphics
Universal Design Diagrams
Icon System: Graphic symbols designed for users with different cognitive abilities.
Color Scheme: Visual design considering users with color blindness.
Multilingual Support: Reduces language dependence through graphics.
Tactile Graphics: Raised graphic guides designed for visually impaired users.
Environment Integration Diagrams
Space Planning: Shows the optimal placement of the equipment in different room layouts.
Storage Solutions: Illustrates various storage methods and space requirements.
Movement Path Design: Arrows show the equipment’s movement path in living spaces.
Renovation Recommendations: Shows necessary home renovation requirements.
Digital Media and Interactive Graphics
Interactive Diagrams
Clickable Hotspots: Users click on specific areas to get detailed information.
3D Rotation: Allows users to view equipment details from multiple angles.
Virtual Operation: Interactive experience simulating the actual operation process.
Troubleshooting: Interactive flowcharts guiding problem diagnosis.
Animations and Videos
Operation Demonstrations: Live-action videos combined with graphic annotations for operations.
Principle Animations: hoyer lift graphic 3D animations showing the equipment’s working principles.
Safety Warnings: Dynamic demonstrations of potential hazards and correct operating methods.
Maintenance Tutorials: Step-by-step graphic demonstrations of maintenance processes.
Customized Graphic Solutions
Personalized Charts
Body Type Adaptation: Generates personalized sling usage diagrams based on the user’s body type.
Environment Simulation: Generates equipment layout diagrams based on the user’s actual living environment.
Progress Tracking: Graphic progress charts designed for rehabilitation patients.
Training Records: Graphically displays training completion status and skill mastery levels.
Conclusion
Graphic materials play an increasingly important role in the understanding, training, and use of Hoyer Lifts. From detailed technical diagrams to intuitive operation guides, from vivid animation demonstrations to interactive learning tools, these visual resources greatly lower the learning threshold, enhance safety awareness, and make complex medical equipment easy to understand. In this visual age, hoyer lift graphic making good use of graphic resources not only improves caregiving skills but also promotes the safe and effective use of equipment, ultimately creating a better experience for both users and caregivers. Let us embrace these visual tools to make caregiving work more intuitive, safe, and efficient.